APPSFLYER CHANGED THE RULES. APPLOVIN TOOK iOS. GOOGLE OWNS ANDROID. RETENTION GOT FIRED.
The 2026 Index covers 27.2B paid installs. AppLovin leads iOS gaming; Google owns Android. But the biggest change is how quality is scored.
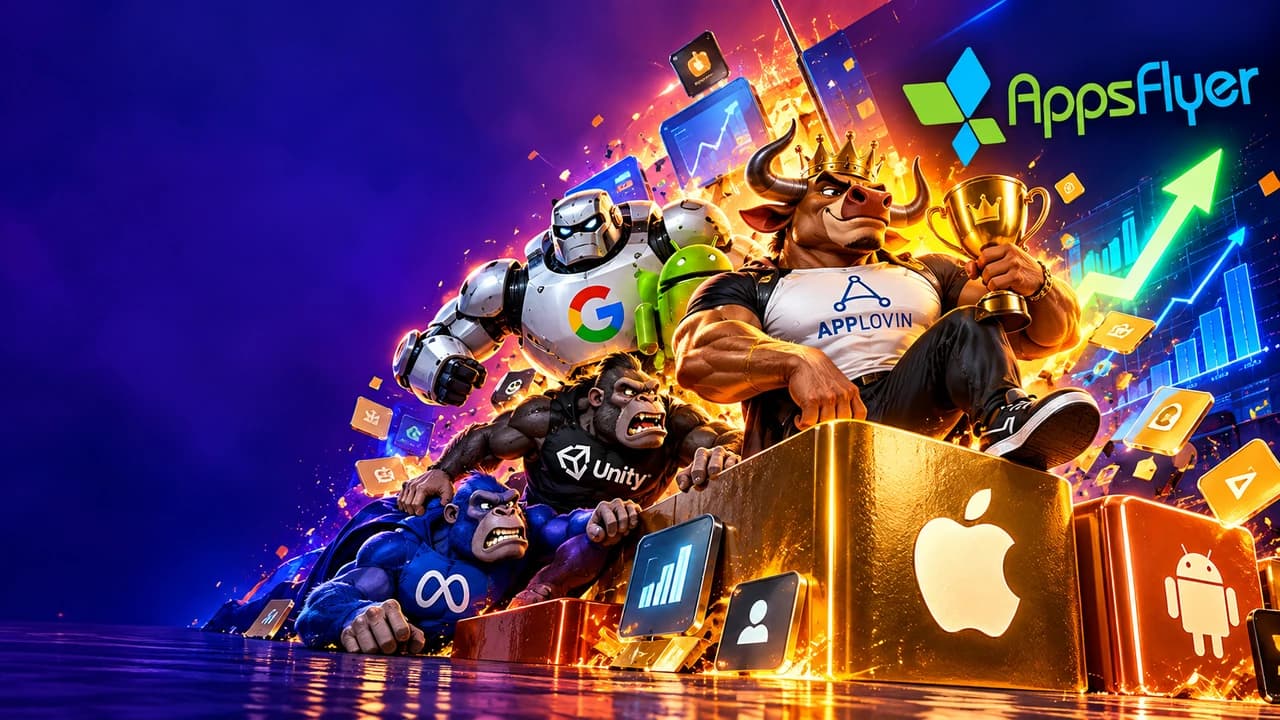
BETDILLA editorial illustration
AppsFlyer has changed the scoreboard. The 2026 Index replaces retention-based quality with quarter-over-quarter ad spend changes. Advertiser budgets now act as a vote of confidence. But a rising budget is not the same as rising ROAS. Read the complete official AppsFlyer Performance Index 2026.
27.2 BILLION INSTALLS. NOT A LINKEDIN POLL.
The research includes 27.2 billion paid installs, 42.2 billion remarketing conversions, 25,000 apps and 57 qualifying media sources. It covers April 2025 through June 2026. Nine of the top ten media sources and 17 of the top twenty saw year-over-year ad spend gains.

RETENTION DIDN'T DIE. IT GOT FIRED FROM THE FORMULA.
AppsFlyer replaced retention with quarter-over-quarter spend change as the Index's quality factor. This is a useful signal of where advertisers invest, but it is not proof of incremental profit, LTV, ROAS or payback. The Index measures media-source strength under its methodology, not the P&L of your brand.
iOS GAMING: APPLOVIN TAKES THE CROWN. UNITY ISN'T CLAPPING.
AppLovin ranks #1 globally in both iOS Gaming power and volume, leading 10 of 11 sub-regions. Its power score is 82% above #2 Unity Ads. Unity is #2 in power and #5 in volume; Mintegral is #3 in power and #2 in volume. Apple Ads is #4 in both. That's an important shift, but not a blanket verdict for every app or GEO.
ANDROID: GOOGLE STILL OWNS THE BUILDING.
Google Ads ranks #1 in Android Gaming power and volume. AppLovin is #2 in power, Meta #3, Mintegral #4 and Xiaomi #5. Google's power score is more than twice the second-place network's. Meta, however, edges Google in Social Casino in LATAM and Southeast Asia. Social Casino isn't synonymous with regulated real-money gambling.
XIAOMI GOT THE MEMO. TIKTOK NEEDS GENRE-SPECIFIC BRIEFS.
Xiaomi climbs from #14 to #8 in Android Gaming volume and ranks #5 in power. TikTok is #4 in Casino and #5 in Sports & Racing power, but #10 in Puzzle & Lifestyle. 'TikTok wins' isn't a buying strategy. Category, creative, GEO and unit economics determine the real result.
NON-GAMING: APPLE OWNS iOS. GOOGLE OWNS ANDROID.
Apple Ads tops iOS non-gaming power and volume, ahead of Meta and Google in power. Google ranks #1 in Android non-gaming, followed by Meta and TikTok. AppLovin ranks #6 in iOS non-gaming power, showing that it is no longer just a gaming story.
META TAKES REMARKETING. MINTEGRAL AND META SPLIT CREATIVE GLORY.
Meta ranks #1 in global remarketing power for iOS non-gaming, Android non-gaming and Android gaming. In the Creative Index, Mintegral dominates many gameplay and animated gaming slices, while Meta is strongest in real-life scenes. Network choice and creative format belong in the same test plan.
BETDILLA TAKE: SHOW THE BUDGET. THEN SHOW THE PROFIT.
This is an invaluable map of where mobile money is moving, not a universal ROAS leaderboard. Performance teams should test network × GEO × OS × creative format and measure CPI, registration, first deposit or subscription, D7/D30 value and payback using their own attribution and commercial data. Big networks win rankings. Great buyers win margins.
Sources and fact-checking
AppsFlyer Performance Index 2026 ↗AppsFlyer 2026 methodology ↗18+. For information only. This is not gambling advice. Availability of gambling products depends on local laws.